Building a Scalable Log Aggregation System with CloudWatch Logs, Amazon OpenSearch, and Kibana on AWS
Table of contents
- Architecture
- Lab Step 1: Creating Logs Using AWS Lambda
- Lab Step 2: Manually Viewing Logs in Amazon CloudWatch
- Lab Step 3: Launching the OpenSearch Domain
- Lab Step 4: Sending CloudWatch Logs to OpenSearch
- Lab Step 5: Discovering and Searching Events
- Lab Step 6: Visualizing Aggregated Events
- Lab Step 7: Creating a Kibana Dashboard
- Conclusion
- Resources
Hello Devops Amigos!!! Today We will construct a powerful log aggregation system using AWS Lambda, CloudWatch, and Amazon OpenSearch. By the end of this blog, you'll have a sophisticated setup that can scale with your needs, offering valuable insights into system usage, aiding in debugging, and enhancing overall operational efficiency. So, let's dive in!
This blog covers everything from setting up Amazon OpenSearch to creating visualizations and dashboards using Kibana, empowering you to manage and monitor your distributed systems effectively.
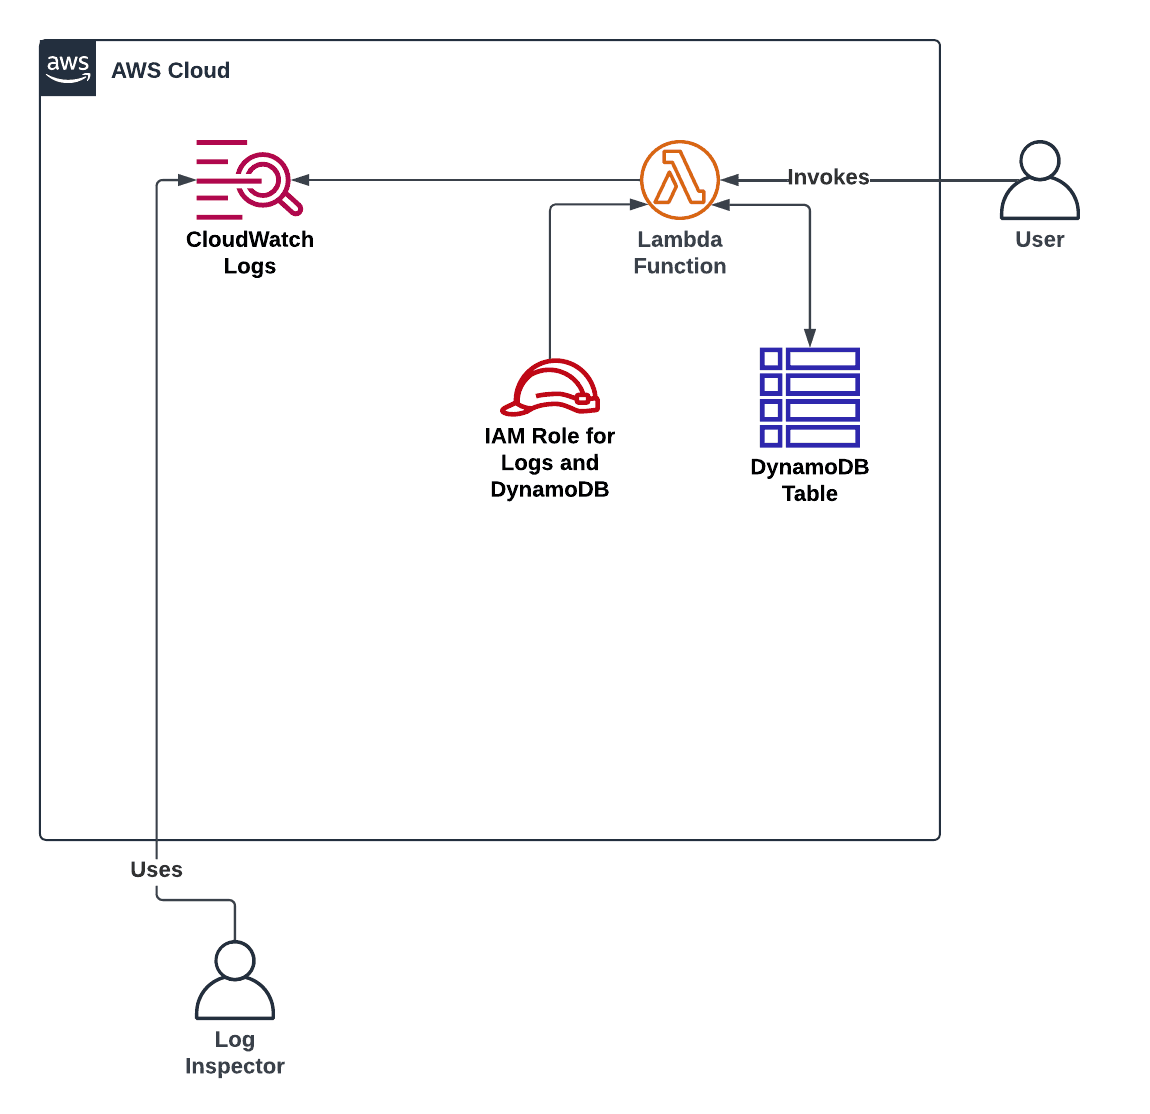
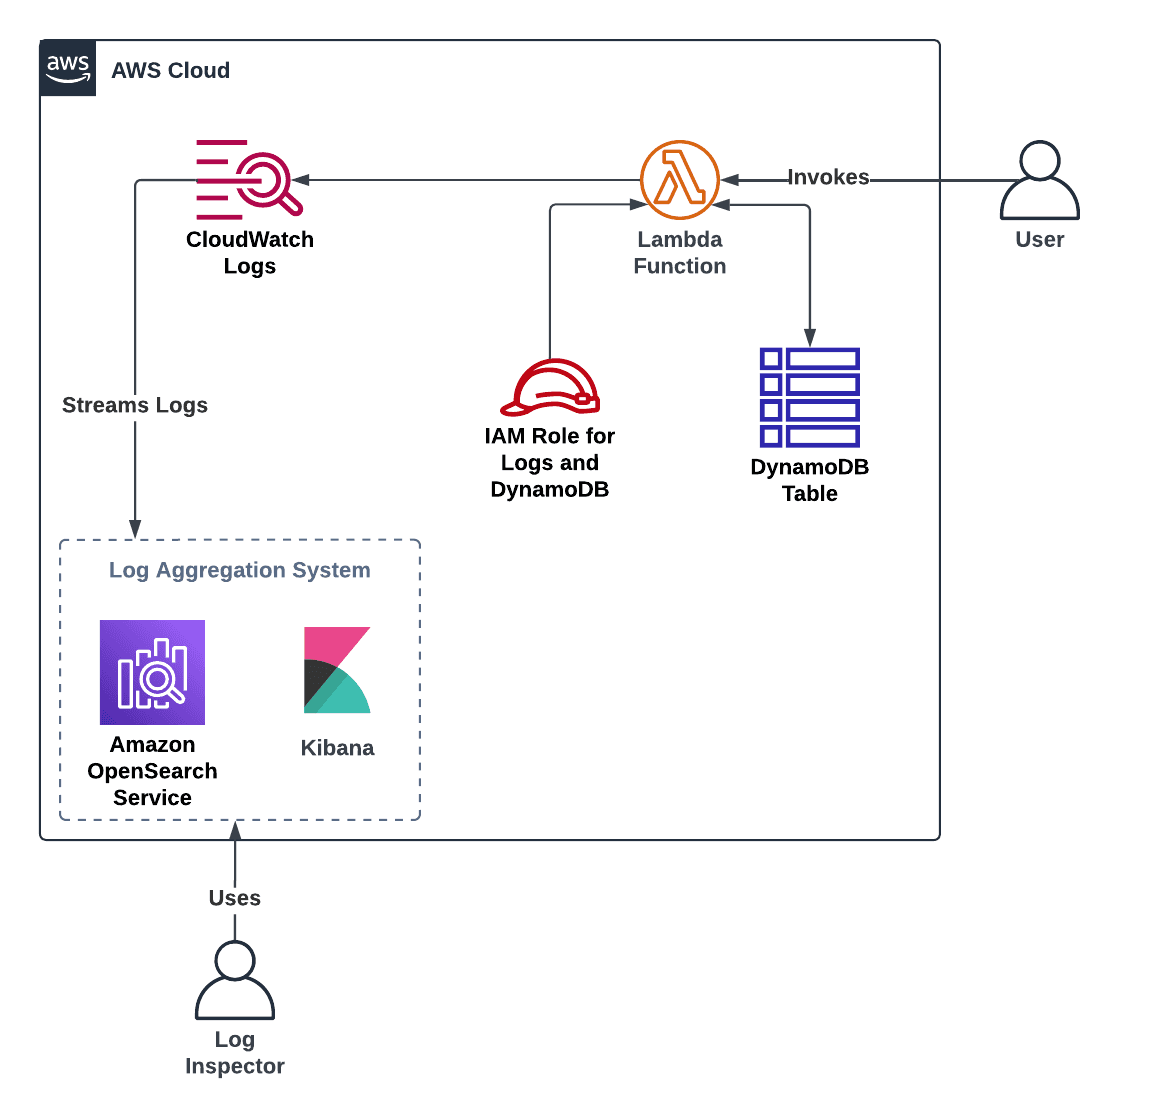
Architecture
Before
After
Lab Step 1: Creating Logs Using AWS Lambda
Welcome to the AWS Lambda playground! We're about to execute a Lambda function and witness the magic of log generation sent straight to CloudWatch.
Navigating to AWS Lambda
Open the AWS Management Console.
Enter "Lambda" in the search bar and click on the Lambda result under Services.

Accessing the Lambda Function
- Locate and click on the
cloudacademylabs-DynamoLambdafunction in the Functions list.
- Locate and click on the

Exploring Lambda Function Console
- Take a moment to explore the Lambda function console, understanding the Designer and Function code sections.

Configuring a Test Event
- Scroll down to the Code source section and click Test to configure a test event.
Configuring Test Event Details
Enter
TestPutEventas the Event name.Enter the provided JSON in the code editor.
Click Save.

Running the Function with Test Event
Run the function by clicking Test again.
View the Execution results tab for function logs.

Viewing CloudWatch Logs
Click the Monitor tab.
Click View CloudWatch Logs.

Conclusion
In this step, you executed a Lambda function, triggered a test event, and viewed the generated logs in Amazon CloudWatch. This process showcases how AWS Lambda seamlessly sends logs to CloudWatch, laying the foundation for effective log analysis.
Lab Step 2: Manually Viewing Logs in Amazon CloudWatch
Now, let's delve into CloudWatch Logs exploration, manually inspecting logs to gain insights into log streams and filtering capabilities.

Observing Log Streams
- Observe Log Streams in the CloudWatch log group for the Lambda function.

Viewing Log Stream
- Click on the latest Log Stream to explore its log events.

Filtering Events
- Enter "PUT" into the Filter events search bar and press enter.

Expanding Event Details
- Click the triangle to expand the event that matches the filter.
Custom Time Range Filter
- Click custom to display the custom time range filter.
Conclusion
In this step, you explored log filtering capabilities in Amazon CloudWatch Logs, understanding how logs are organized into Log Groups, Log Streams, and Events.
Lab Step 3: Launching the OpenSearch Domain
Now, let's set up your Amazon OpenSearch domain, the backbone of our advanced log aggregation system.
-93aaed36-eeb9-4b09-b8b1-048135024bff.png)
Navigate to Amazon OpenSearch Service
In the AWS Management Console, enter "OpenSearch" in the search bar.
Click on the Amazon OpenSearch Service result.

Start Creating the Domain
On the welcome page, click Create domain.

Fill in Domain Details
Enter a unique Domain name.
Choose Standard create as the Domain creation method.
Select Dev/test in the Templates section.
Choose Domain without standby and Availability Zone(s): 1-AZ in the Deployment Option(s) section.

Configure Engine Options and Data Nodes
Choose Elasticsearch 6.8 under Engine options.
Specify instance type, number of nodes, and EBS storage size per node.

Network Configuration
- Select Public access in the Network section.
Fine-grained Access Control
- Uncheck Enable fine-grained access control in the Fine-grained access control section.

Domain Access Policy
Configure domain access policy using the visual editor, allowing access based on your IP address.
Get IP address from here -> checkip.amazonaws.com

Create the Domain
Scroll to the bottom and click Create.
Monitor the provisioning status; it usually takes 20-30 minutes.

Conclusion
Successfully configured an Amazon OpenSearch domain, the foundation of our advanced log aggregation system. Once it's active, we'll move on to streaming logs into OpenSearch and exploring its capabilities.
Lab Step 4: Sending CloudWatch Logs to OpenSearch
Now, let's establish the integration between CloudWatch Logs and your OpenSearch domain. Follow these steps to create a subscription filter and seamlessly stream logs into OpenSearch.
Navigate to CloudWatch
In the AWS Management Console, enter "CloudWatch" in the search bar.
Click on the CloudWatch result.

Access Log Groups
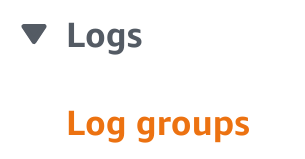
In the left-hand menu, under Logs, click on Log groups.
Select Log Group
- Select the log group for your Lambda function.
Create Subscription Filter
- Click Actions, and under Subscription filters, click Create Amazon OpenSearch Service subscription filter.

Choose Destination
Ensure This account is selected as the Select account.
Choose the OpenSearch cluster you created earlier.
Select Lambda IAM Execution Role
- In the Lambda IAM Execution Role drop-down, select LambdaElasticSearch.

Configure Log Format and Filters
Select Amazon Lambda as the Log Format.
Enter
ca-lab-filteras the Subscription filter name.

Start Streaming
Click Start streaming at the bottom.


Conclusion
Successfully created an Amazon OpenSearch Service subscription filter, connecting your Lambda function's log group to automatically stream logs into your OpenSearch domain. The groundwork is set for us to discover and search events in OpenSearch.
Lab Step 5: Discovering and Searching Events
Now, let's create more test events and explore the discovery and search functionality in Kibana.
Create More Test Events
- Return to the Lambda function and click Test to submit more PUT events.
Configure Test Event
Click the arrow on Test and then click Configure test event.

Create New Test Event
- Create new test events with the provided JSON for GET events.
{
  "fn": "GET",
  "id": "12345"
}
- Save the test event.
Make GET Events
- Click Test several times to generate GET events.
Access Kibana
Return to the Amazon OpenSearch Search Console.
Click the link under Kibana URL.

Connect to Elasticsearch Index
In the Add Data to Kibana section, click Connect to your Elasticsearch index.

Create Index Pattern
Enter
cwl-*as the Index pattern in the Create an index pattern wizard.Click Create index pattern.
Index pattern: Select timestamp in Next Step

Explore the Discover Interface
- Click Discover in the sidebar menu to explore the Discover interface.
Search and Filter
- Enter
PUT 12345in the search bar and observe the highlighted events.
- Enter

Conclusion
You've learned how to use Kibana's discover capabilities to explore and search through data stored in Amazon OpenSearch. The journey continues as we proceed to visualize aggregated events in Kibana.
Lab Step 6: Visualizing Aggregated Events
Great job! Now, let's harness Kibana's visualization capabilities to create an area chart showcasing different log request types over time.
Access Visualize in Kibana
- Click Visualize in the Kibana sidebar menu.
Create a Visualization
Click Create a visualization.

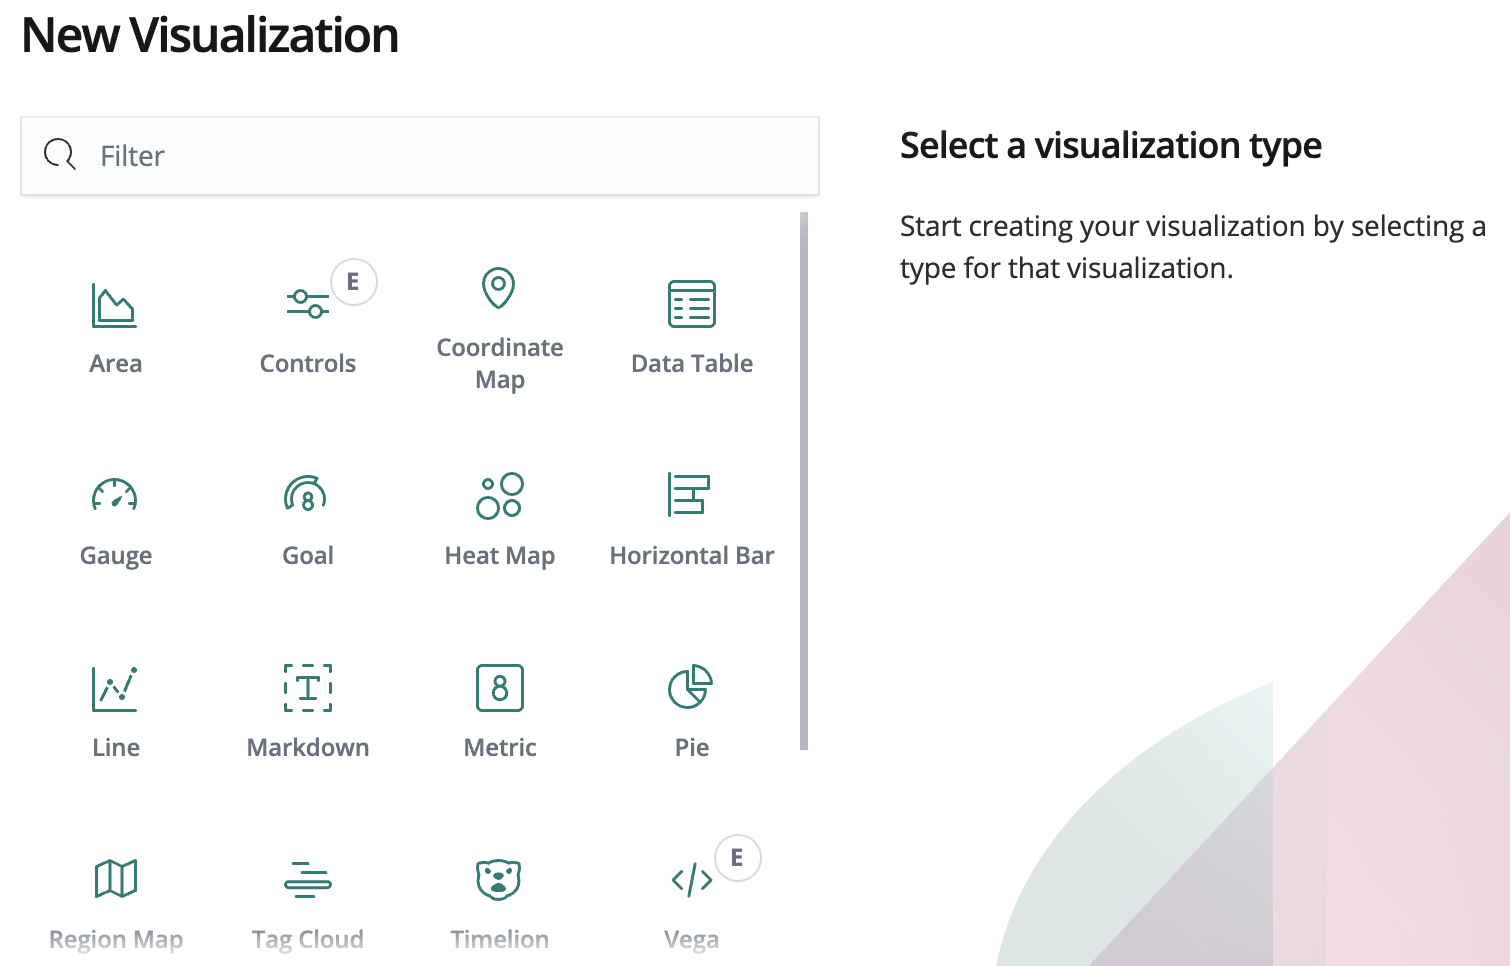
Select Area Chart
Choose Area chart visualization.
Choose Index
Select the
cwl-*index name.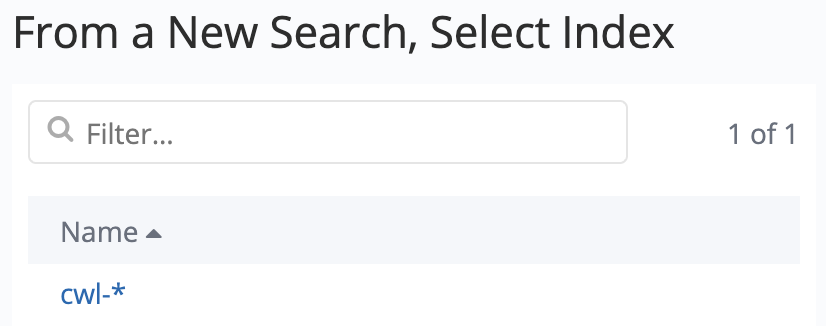
Configure X-Axis
- Configure the X-Axis with Date Histogram.

Add Sub-Buckets
- Add Sub-Buckets for Split Series, using Terms on
$event.data.fn.keyword.
- Add Sub-Buckets for Split Series, using Terms on
Apply Changes
Click the play button to apply changes and produce the visualization.

Save Visualization
- Save the visualization with the name "PUTs and GETs Over Time."

Conclusion
In this step, you created an area chart visualization in Kibana, offering insights into different log request types over time. Kibana provides a plethora of visualization tools that we'll explore further.
Lab Step 7: Creating a Kibana Dashboard
Let's tie everything together by creating Kibana dashboard, combining visualizations to provide an overview of the entire system.
Access Dashboard in Kibana
- Click Dashboard in the sidebar menu.
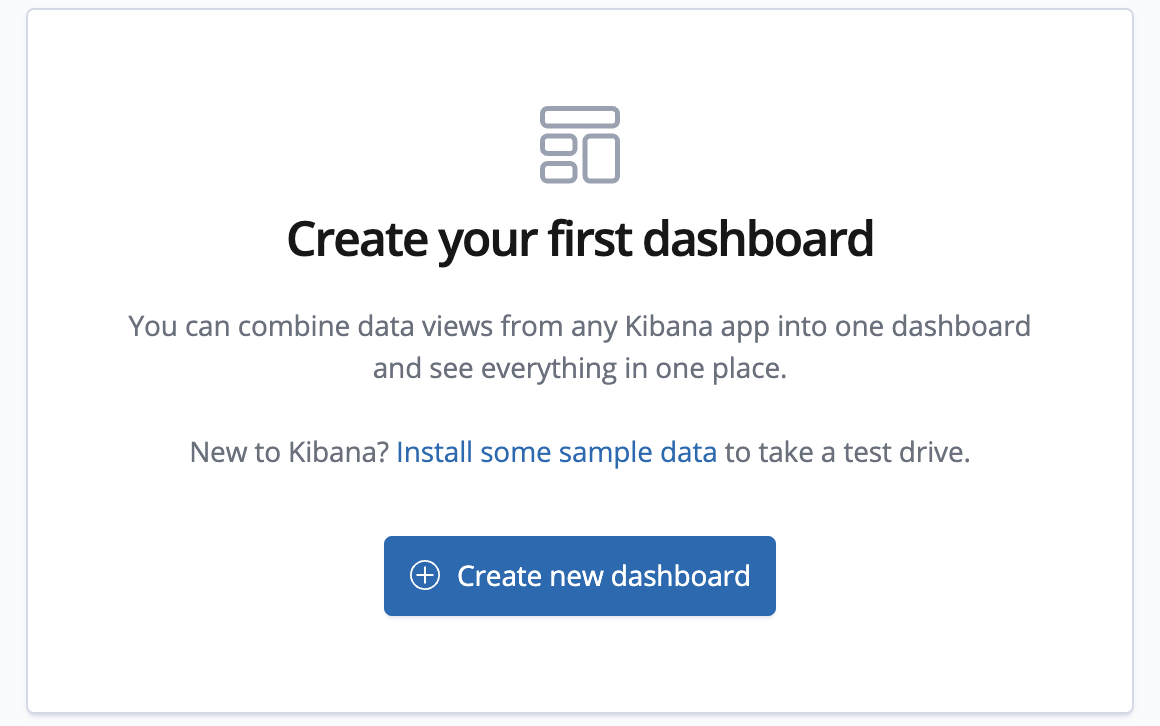
Create a Dashboard
Click Create a dashboard.
Add Saved Visualization
Add the saved visualization "PUTs and GETs Over Time" to the dashboard.

Adjust Visualization Size
- Adjust the size of the visualization as needed.
Save Dashboard
- Save the dashboard with the title "Log Dashboard" and a description like "Lambda API Logs."

Generate Test Events
- Return to the Lambda console and create test events.
Refresh Kibana Dashboard
Refresh the Kibana dashboard to see new requests in the visualization.
Configure Auto-refresh for real-time updates.

Conclusion
Congratulations! You've completed the task, constructing a sophisticated log aggregation system using Kibana running on the Amazon OpenSearch Service. This system is a valuable tool for your team, offering insights into system usage, aiding in debugging, and providing operational visibility.
Resources
This is lab from CloudAcademy:
https://cloudacademy.com/lab/aws-devops-pro-monitoring-build-log-aggregation-system/
How to Implement & Enable Logging Across AWS Services (Part 1 of 2)
How to Implement & Enable Logging Across AWS Services (Part 2 of 2)
Understanding AWS Lambda to Run & Scale Your Code
https://docs.aws.amazon.com/cloudwatch/
https://docs.aws.amazon.com/lambda/latest/operatorguide/monitoring-observability.html
https://docs.aws.amazon.com/opensearch-service/latest/developerguide/admin-options.html
Thank you for joining this journey! I hope you've gained valuable skills in CloudWatch Logs, Amazon OpenSearch, and Kibana. If you have any questions or need further assistance, feel free to reach out me at Linkedin. Happy logging! 🚀🔍
If you enjoy content like this, please hit the follow button and subscribe to my newsletter to stay updated on future blogs.